What percentage of searches have AI Overviews: check the denominator before you repeat the number
Somebody has just put a percentage in front of you. It says Google AI Overviews now appear on about half of everything people type into Google, or on a fifth, or on one in eight, and whichever version reached you it arrived without the one word that would let you check it.
That word is the denominator. A percentage of what, exactly.
A Google AI Overview is the AI generated summary Google places above the ordinary organic results, answering the query directly instead of only listing pages. Nobody outside Google can see how often it fires, so every vendor measuring it parses search results at scale and decides, page by page, whether a summary was there. Not one of the vendors below publishes the rule it uses to make that decision, and the one page that tries to reconcile their figures names detection methodology as a reason they differ. That is before anyone asks the harder question of what each vendor divided by.
We opened all nine pages ranking in the United States for this question on 17 September 2026, then opened the primary sources behind their figures the same day. The numbers are not competing estimates of one quantity that somebody measured carelessly. They are percentages of five different populations: a keyword a vendor was already tracking, a search query counted once however many times it was typed, a desktop results page, a panel whose composition is not disclosed, and the queries Google actually served — that last one attached to a figure we could not trace to any Google page. Almost nobody prints which. So the figures get stacked in tables, divided by one another and, in one case we can show you, turned upside down.
Before any of it, two things you are entitled to know about us. We have measured nothing about how often AI Overviews appear, and we publish no prevalence figure of our own below — every one belongs to somebody else and carries its owner, its date and its unit. And one of the nine pages returned only its navigation and its byline to us on three separate attempts, so we make no claim at all about what is written on it.
If you have a minute rather than ten, the four-question checklist headed "Four things to ask before you repeat an AI Overview figure" is the part to take away.
What percentage of searches have AI Overviews?
Ahrefs found AI Overviews on 20.5% of desktop search results pages in September 2025 — 29,991,998 of 146,122,391, and that is the best-documented figure in this set for one reason: Ahrefs printed both halves of the fraction in the sentence making the claim. Nobody else here does.
Read the unit carefully, because it is doing the work. That is a share of desktop SERPs sampled in one month — a SERP being one search results page for one query — and not a share of the searches people actually ran. A results page exists for a query whether that query was typed once or ten million times.
The other published figures for the same question, each with the month its owner states and the population where its owner states one, run from about a fifth to about half. That spread is not an uncertainty interval, and reading it as one is the mistake this article is about. It is five questions with five answers, all wearing the same sentence.
So the honest answer for a reader who wants one number for today is that there is not one, and the reason is specific rather than a shrug: the published figures do not share a denominator, and several of the pages carrying them never say what theirs is. What you can have instead is the ability to tell, in about thirty seconds, which question any figure in front of you actually answered.
What is each figure a percentage of?
The five published figures divide by five different populations — five different sets of things counted, not one quantity measured five ways: a keyword a vendor was already tracking, a search query counted once however many times it was typed, a desktop results page, a panel whose composition is not disclosed, and, if the attribution holds, the queries Google actually served.
| Figure | Owner | A percentage of | Population and window | Country | |---|---|---|---|---| | 48% | BrightEdge, 12 Feb 2026 | tracked keywords | nine verticals, Feb 2025 – Feb 2026; set size not stated | not stated | | 25.11% | Conductor, updated 6 Jul 2026 | unique Google searches | 21.9 million, 15 Sep – 12 Oct 2025 | United States | | 20.5% | Ahrefs, 10 Nov 2025 | desktop SERPs | 146,122,391, September 2025 | not stated | | 43%+ | Similarweb, 29 Jul 2026 | not disclosed | not disclosed | United States | | "roughly 50%" | attributed to Google, Feb 2026 | queries served, if the attribution holds | — | United States |
A tracked keyword. BrightEdge defines its own metric, on 12 February 2026, as "the percentage of tracked keywords triggering an AI Overview, daily over 12 months". Its headline sentence a paragraph later reads "AIO presence has grown from roughly 30% to 48% of tracked queries over the past year" — keywords in the definition, queries in the headline, on one page. The report names nine verticals and a twelve-month window, and it never says how many keywords the tracked set holds, how they were chosen, or which country's search results were parsed.
A unique search query. Conductor found an AI Overview on 5.5 million of 21.9 million unique Google searches in the United States between 15 September and 12 October 2025 — 25.11%. Its benchmarks report, last updated 6 July 2026, states the sample plainly: "We analyzed approximately 21.9 million unique Google searches from Conductor's traditional search index." The word carrying the weight is unique. A search query that millions of people ran is one row, exactly like a query run twice.
That same study also shows how far the composition of a set moves the answer with no argument about units at all. In Conductor's own numbers, health care queries returned an AI Overview 48.75% of the time and real-estate queries 4.48% — one method, one window, one country, and a gap of more than ten times between two industries. A vendor whose tracked keywords lean medical and a vendor whose keywords lean commercial will disagree profoundly while both count correctly.
A desktop SERP. Ahrefs counts results pages, in a named month, on desktop only. Mobile carries a different mix of queries and Google has never published the split. Even here the unit slips: beside the fraction, the same page prints its takeaway as "AIOs appear on 21% of all keywords" — the slide BrightEdge makes between keywords and queries, made here between results pages and keywords, on the best-documented figure in the set. Nothing in the data changed between those two sentences. The word did.
A panelled query, undescribed. Similarweb puts the United States rate above 43% on 29 July 2026 — "a 43%+ AI Overview appearance rate in the US" — and the page carrying it says nothing else about it: no number of queries, no panel composition, no desktop-and-mobile split, no rule for deciding a summary was present. The figure travels widely, and nothing on the page that published it tells a reader what it is a percentage of.
A query Google actually served — and here we stop. The "roughly 50%" circulating as Google's own disclosure would be the only figure in this set weighted the way real search traffic is weighted. We could not find it on a Google page; the citation we followed is dealt with below. We are not saying Google said it and we are not saying Google did not. We could not verify it, so it is not used here as a data point.
The consequence takes one sentence. In three of those five populations a search query run ten million times counts exactly as much as a query run twice, so none of the three can tell you what share of real searching carries an AI Overview, however carefully each was measured. Ranking pages set them side by side anyway, and a reader with no way of telling which is which concludes the industry cannot count.
This is one corner of a problem we have written about in another: a citation with a link, a brand mention without a link, a domain, a page and a quoted passage are five different units of measurement, and reports move between them freely and often silently. Prevalence figures do the same thing with the bottom half of the fraction, and the bottom half is where a reader has no way of checking.
What happens when the figures get copied
The denominators get dropped — and on the most careful page in this ranking set, dropping them produces three errors any reader can check in a couple of minutes.
The credit comes first, because it is owed. Omnibound's statistics page of 25 June 2026 is the only page here that attributes every prevalence figure in its table to a named owner, publishes an update policy, and tells the reader why studies differ: "AI Overview prevalence statistics vary significantly across studies due to differences in keyword set composition, device mix, geography, and detection methodology". It reconciles the instruments rather than picking a favourite, and it commits to a number it is willing to defend — "The defensible range is 20–50%, with higher numbers emerging from informational-heavy query sets and lower numbers from mixed or transactional sets". It even accounts for the widest gap in its own table, arguing that one vendor's panel leans toward keyword-research strings while another tracks commercial verticals. That is more care than the rest of the ranking set shows between them, and nothing below argues the page is dishonest.
Three things on it are checkable, and all three are the same failure.
The growth claim divides one company's figure by another company's. The lead states a January 2025 baseline, an early-2026 figure, and a near eightfold expansion in fifteen months, attributing the pair to BrightEdge's Generative Parser and to Google. The page's own table, further down, attributes that January 2025 baseline to Semrush's keyword study. The baseline is a share of one vendor's tracked keywords; the endpoint is a share of another vendor's differently chosen tracked keywords. We are not reprinting the baseline figure here, because we publish that series with its instrument and its limits on a separate page — but the lead and the table sit on the same page a few screens apart, and they do not agree about whose number it is.
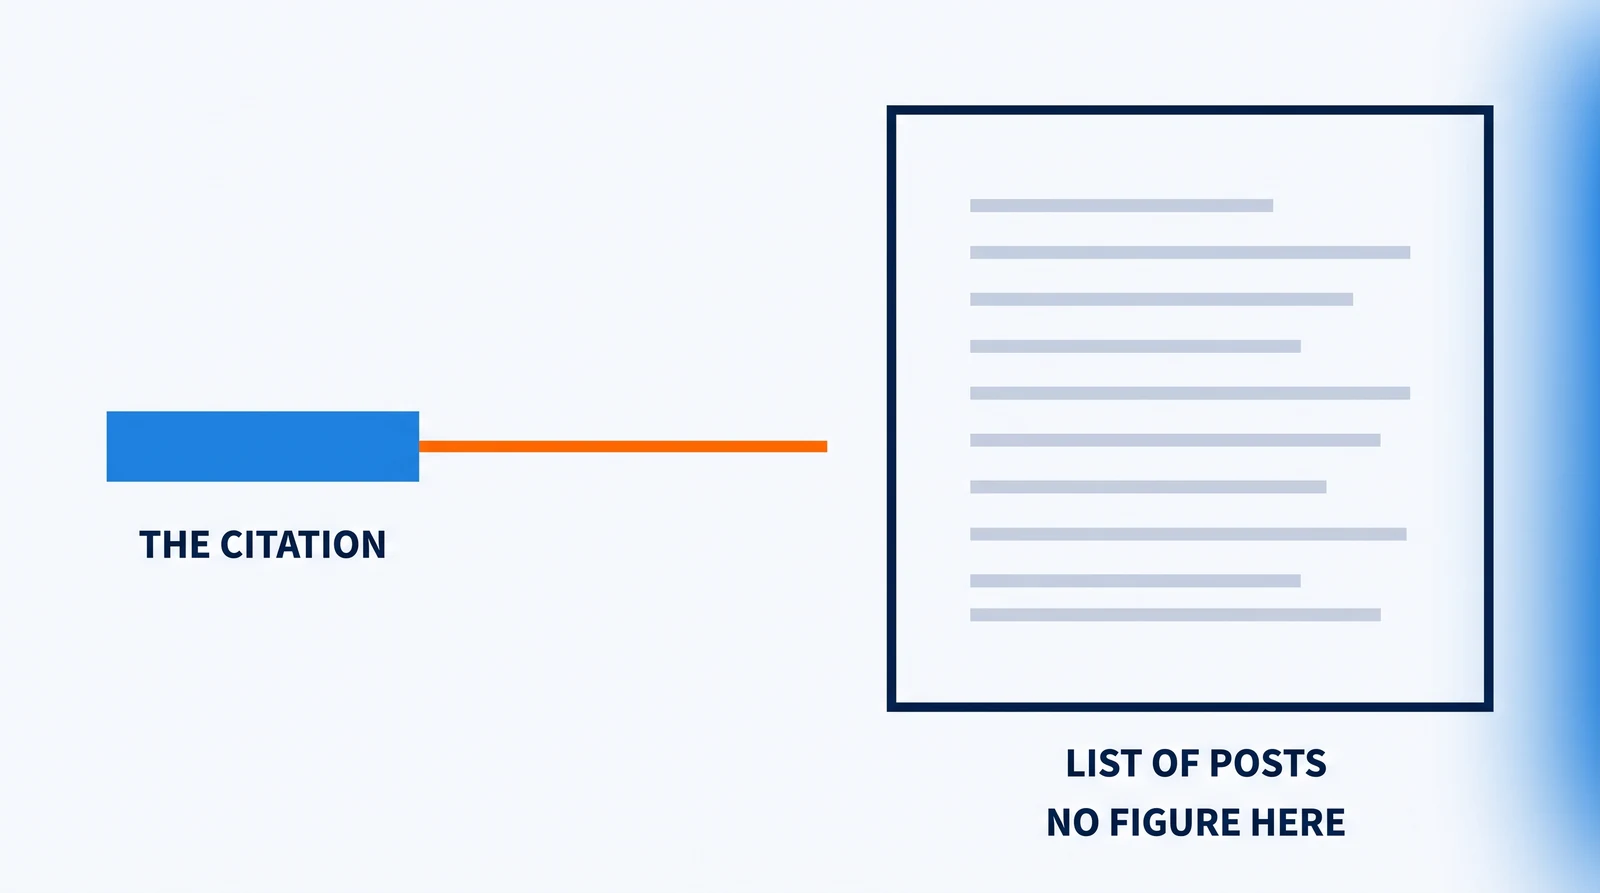
The Google citation points at a section index. The table row reading "Google's own disclosure — 'Roughly 50%' of US queries" links to `blog.google/products/search/`. We opened it on 17 September 2026. It is the Search section of Google's blog — a list of posts, headed that day by an article about preparing for a race — and it carries no prevalence statement of any kind. A section index is not a disclosure. The figure may well have been said somewhere; this citation does not show where, and it is the citation carrying the only number in the set that would represent queries Google actually served.
A collection window is out by two quarters. The table's Conductor row is labelled "Q1 2026". Conductor states the window as 15 September to 12 October 2025. The report was last updated in July 2026, which is presumably where the label came from — and that gap is exactly the difference between the date on a page and the date of the data underneath it.
None of this is fraud. It is what happens when five figures go into one table with no column for the denominator, and it matters because this is the page a hurried reader is most likely to trust — the one that looks most like it has done the work.
The number that was never a prevalence rate
The 99.2% now circulating as a share of informational queries is Ahrefs' share of AI Overview keywords, with the denominator reversed — and in its original form it cannot answer this question at all.
Ahrefs published it in October 2024: "As it stands, 99.2% of all AI Overview keywords are informational." Take the sentence slowly. The keywords being counted are the ones that already show an AI Overview. Of those, almost all have informational intent. It is a statement about what kind of query tends to get a summary.
Search Atlas, published 2 March 2026 and updated 26 May 2026, carries the same number the other way round: AI Overviews appear "in 99.2% of informational queries such as 'how to' or 'why is' searches, while appearing in only 4.5% to 12.5% of total queries overall". The denominator has been swapped. One version says almost every AI Overview sits on an informational query; the other says almost every informational query gets an AI Overview. Only one of them is on the Ahrefs page.
The reversed version does not survive its own neighbours either. A few paragraphs away the same page states that "AI Overviews currently trigger for 59% of informational queries and 19% of commercial queries", elsewhere that they "trigger for 30% to 40% of informational and commercial queries in the United States", and elsewhere again "approximately 30% of searches". Ninety-nine per cent of informational queries and fifty-nine per cent of informational queries cannot both hold on one page in one month. Not one of those figures carries a source.
There is a structural reason the 99.2% can never become a prevalence rate. The Ahrefs study compared "150K of the most searched keywords that generate an AI Overview, vs. 150K of the most searched keywords without an AI Overview" — a matched design, half and half by construction. Its ratio of summaries to everything else was chosen by the researcher before any data arrived. No share of all searching can be derived from it by anybody, ever.
That same Ahrefs page is also on the receiving end of a second misattribution. The page ranking second for this question states that "Google AI Overviews now show up in nearly 55% of all Google searches" and links those words to the October 2024 study. The study contains no 55%, and no prevalence rate of any kind. The same page asserts that "around 50% of search queries in the United States now generate Google AI Overview responses" with no citation at all, and that AI Overviews appear "in only about 7% of local searches", again with nothing attached. It displays no publication date and no update date anywhere on it, though its address ends in 2026.
How much of the gap is time rather than method?
Semrush put its Sensor tracker at around 12.95% of United States search queries in February 2026, and Search Engine Roundtable read about 48% off that same tracker five months later — one instrument, one vendor, and no methodology difference to argue about.
Two figures sit side by side in Barry Schwartz's post of 30 July 2026: "new data from Similarweb says that AI Overviews show up for about 43% of all queries. Meanwhile, Semrush data has it at about 48%". Follow the second link and it does not go to a study. It goes to Semrush Sensor, a live tracker of search results features.
Now read Semrush's own page of 5 February 2026: "According to Semrush Sensor (which analyzes Google search results across millions of keywords), AI Overviews currently show up for around 12.95% of search queries on average in the U.S. market."
Same tracker, same vendor. Thirteen per cent in February, forty-eight in July. Something moved that fast through the first half of 2026, and the most likely candidate by far is the feature itself rather than the instrument. Semrush says as much on the same page — "Google is continuously adjusting the appearance of AI-generated answers in search results" — and reports a matching shift in what the summaries land on, with keywords triggering an AI Overview going "from being 89.03% informational in October 2024 to just 57.16% informational in October 2025". Barry Schwartz makes the point almost in passing: "I covered these percentages a year ago and it was at about 13% to 20%."
So a reader who takes two figures a year apart from two vendors and concludes that nobody in this field can measure has drawn the wrong lesson from the right observation. Some of the disagreement is denominators. A large share of it is a fast-moving product read at different moments. Both are reasons to refuse a figure with no date on it; neither is a reason to believe the counting is hopeless.
We would rather say that than keep an argument that is only half true. The denominator problem is real and it is the useful half of this article. It is not the whole explanation, and we are not going to pretend otherwise.
Does the denominator actually change the answer?
Ahrefs reported 16.48% of US keywords and 11.8% of US keyword search volume from the same analysis over the same two months of 2025 — two figures four and a half points apart, from one dataset, with nothing varying between them but the denominator.
Ahrefs published both in the same post in May 2025. Counting keywords: "the percentage of US keywords triggering AI overviews in search results has also doubled–jumping to 16.48%, up from just 7.6% on March 13th". Weighting those same keywords by how much searching each one represents: "AI overviews now account for 11.8% of all US-based keyword search volume, compared to 6.2% on March 13th". One company, one two-month window from 6 February to 6 May 2025, one keyword set — the study describes 25 million AI Overview keywords inside it — and two answers.
That study is from May 2025 and its numbers are not offered here as a current rate. AI Overviews have changed repeatedly since, and quoting a sixteen-month-old prevalence figure as today's is this same error in another dimension. What the study is good for is the mechanism, and on the mechanism it is the clearest published demonstration available: one team, one dataset, both denominators printed, and they disagree.
The direction is worth noticing, because it is not the one most people assume. The volume-weighted figure was the lower of the two, and our reading of that — not a statement Ahrefs makes — is that the summaries in that sample fell more often on keywords with modest search volume than on heavily searched ones. You could not have guessed it from outside the data. That is the point. Weighting is not a rounding difference to wave away, and both the size and the direction of its effect are properties of the data rather than of arithmetic.
The pages that publish no figure at all
Google's own product page, Surfer's study and Elementor's statistics collection carry no prevalence share between them, and each has a different reason.
Google's page about AI Overviews states no share. It describes the feature and its reach — "currently available in over 120 countries and territories, and 11 languages" — and leaves how often it appears unsaid. That reach line is worth a moment, because it is this article's own point happening on Google's own site: Google's blog said on 20 May 2025 that AI Overviews were "now available in more than 200 countries and territories and in more than 40 languages", and the product page still carried the older pair when we opened it on 18 September 2026. That is availability, not prevalence, and it says nothing about how often a summary appears — but the company with the best data on this feature is running a live page its own blog superseded sixteen months ago. Google holds better data on that than anyone and publishes none of it.
Surfer analysed 405,576 AI Overviews in Google's search results, English-language queries only, capturing "the full top 10 organic results alongside the sources cited in the AI overview" for every query, in a study last updated 11 August 2026. It is large, carefully described and not a prevalence study. A count of summaries has no denominator by construction: it cannot become a share without knowing how many searches were examined in total. Surfer does not claim otherwise. The number simply gets quoted elsewhere as though it answered this question.
Elementor published six AI Overview statistics on 29 June 2026 and no prevalence rate among them. It states that "Over 68% of Terms That Trigger AI Overviews Get 100 or Fewer Monthly Searches" and that "Over 88% of Searches That Trigger AI Overviews Are Informational", both of which bear directly on everything above — and neither carries an external source we could follow. We are not using them as evidence for that reason, and it is a genuine loss, because the first would speak straight to the weighting question.
The ninth page, from the Digital Marketing Institute, returned only its header, navigation and byline to us on three attempts; its body never rendered. We do not know what it says and we are not going to characterise it.
Four things to ask before you repeat an AI Overview figure
Ask what the percentage is of, whose set it came from and how big that set is, when and where the data was collected, and who is quoting whom. We chose those four and we have an interest in them: we build measurement tools, and a company selling measurement does well out of readers who interrogate measurements, so weigh the list knowing that. It binds us too, which is why no number in this article is ours — we have not run this test.
A percentage of what? Tracked keywords, unique search queries, results pages, or queries actually served — the four units anybody in this set actually names, out of identical underlying reality. The fifth figure names none at all. If the page does not say, its figure cannot be set against any other figure, and that is not a footnote — it is the whole claim. The difference between a fifth of searching and half of it is the difference between a feature to keep an eye on and a change to plan a year around, which is why this is not pedantry.
Whose set, and how big? A vendor's tracked keyword list is a commercial decision before it is a sample: it reflects what that vendor's customers pay to monitor. Two of the figures above state no set size at all. As we put it when we audited an AI search data platform against our own measurement, a vendor who shows you a figure without its sample is asking to be believed rather than checked.
When, and where? The collection window, not the publication date — a report updated in July can rest on data gathered the previous autumn, and one page above got exactly that wrong about somebody else's study. And the country: an AI Overview rate is national, and most figures here are United States figures whether or not they say so.
Who is quoting whom? Click the citation. It is the cheapest check on this list and it caught three separate problems on the first page of results in one afternoon: a growth claim built from two vendors' numbers, a disclosure citation pointing at a blog section index, and a 55% credited to a study that contains no such figure. No tooling is required. You need the link and thirty seconds.
When all four answers are on the page, you can compare that figure with another that answers them the same way. When they are not, you are holding a number that will sound authoritative in a meeting and come apart the moment somebody asks a question.
What people actually ask us
What percentage of searches have AI Overviews on Google? The figure with the clearest paperwork is 20.5% — 29,991,998 AI Overviews on 146,122,391 desktop SERPs sampled by Ahrefs in September 2025. Attach the denominator whenever you repeat it: that is a share of results pages in one month, not of queries served, and other reputable vendors publish figures roughly twice as high on differently built sets. There is no single correct answer for today, and a page handing you one without saying what it counted has not answered the question.
How do I get an AI Overview in Google? You do not switch it on. Google's product page still says the feature is "currently available in over 120 countries and territories, and 11 languages", while Google's own blog put it at "more than 200 countries and territories and in more than 40 languages" on 20 May 2025 — so for most readers, on either count, it appears by itself on some queries and not others. What decides which is a question we have not measured, and we are not going to pass on somebody else's untested theory about it. Several pages in this ranking set will happily tell you; ask each one what it measured before you act on it.
Are the zero-click percentages people quote alongside this the same thing? No. Google's own related questions put two of them next to this one, and they measure a share of searches that ended without anybody clicking — which is not a share of searches that displayed an AI Overview, and does not become one however often the two are printed together. Mixing them is how a reader ends up believing one figure explains the other. We worked through the zero-click studies on their own page, with what each one counted and over what sample, and that is where those numbers belong.
Does any of this tell me about ChatGPT or AI Mode? No, and that is worth saying plainly. Every figure above is about one surface: the summary on a Google search results page. AI Mode, ChatGPT, Perplexity and the rest are separate products with separate answer surfaces and separate measurement problems, and a prevalence figure for AI Overviews carries no information about any of them. The same unit-confusion runs through the numbers published about which assistants people use, which we have written up separately. Nothing in this article depends on it.
Sources
All checked 17 September 2026, and every quotation above re-verified on 18 September 2026.
- Ahrefs, "What Triggers AI Overviews? 86 Factors and 146 Million SERPs Analyzed", 10 November 2025 — https://ahrefs.com/blog/ai-overview-triggers/
- Ahrefs, "AI Overviews Have Doubled (25M AIOs Analyzed)", 13 May 2025 — https://ahrefs.com/blog/ai-overview-growth/
- Ahrefs, "I Analyzed 300K Keywords. Here's What I Learned About AI Overviews", 31 October 2024 — https://ahrefs.com/blog/ai-overview-keywords/
- BrightEdge, "AI Overviews: One Year of Presence, Size and Citing", 12 February 2026 — https://www.brightedge.com/resources/weekly-ai-search-insights/ai-overviews-one-year-presence-size-citing
- Conductor, "The 2026 AEO/GEO Benchmarks Report", last updated 6 July 2026 — https://www.conductor.com/academy/aeo-geo-benchmarks-report/
- Similarweb, "AI Search Stats in 2026", 29 July 2026 — https://aisearch.similarweb.com/blog/gen-ai-stats/
- Search Engine Roundtable, "Almost Half Of Google Searches Have AI Overviews & Climbing", 30 July 2026 — https://www.seroundtable.com/half-google-searches-ai-overviews-41780.html
- Semrush, "Google AI Overviews", 5 February 2026 — https://www.semrush.com/blog/ai-overviews/
- Omnibound, "Google AI Overviews Statistics (2026)", 25 June 2026 — https://www.omnibound.ai/blog/google-ai-overviews-statistics
- Search Atlas, "AI Overviews", published 2 March 2026, updated 26 May 2026 — https://searchatlas.com/blog/ai-overviews/
- Heroic Rankings, "Google AI Overview Statistics 2026" — https://heroicrankings.com/seo/managed/google-ai-overview-statistics-2026/ — no publication or update date displayed on the page.
- Surfer, "AI Overviews Study", last updated 11 August 2026 — https://surferseo.com/blog/ai-overviews-study/
- Elementor, "AI SEO Statistics", 29 June 2026 — https://elementor.com/blog/ai-seo-statistics/
- Google, "AI Overviews" product page — https://search.google/ways-to-search/ai-overviews/
- Google, "AI Overviews are now available in over 200 countries and territories, and more than 40 languages", 20 May 2025 — https://blog.google/products-and-platforms/products/search/ai-overview-expansion-may-2025-update/
- Google, Search section of the Google blog — https://blog.google/products/search/ — opened as the target of a "Google official disclosure" citation; it is a section index and carries no prevalence statement.
- Digital Marketing Institute, "Google AI Overviews: What Do They Mean for Search?", 22 October 2025 — https://digitalmarketinginstitute.com/blog/google-ai-overviews-what-do-they-mean-for-search — body did not render on three attempts; nothing is quoted from it.
- LiamVi research: our methods, our samples and our limits — https://liamvi.com/research/