
Does adding statistics increase AI citations: what the GEO study measured, and for which pages
If you put more statistics on your website, will AI assistants such as ChatGPT, Perplexity, Claude, Copilot, Google AI Overviews or AI Mode cite it more often? Three of the results Google returned for that question in the United States on 23 September 2026 answer it by pointing to one peer-reviewed paper, GEO: Generative Engine Optimization, the paper that gave generative engine optimization its name. The subject here is numbers in your own content and whether AI search tools quote it. If you came looking for help with AI-made references for coursework, or with statistics as a school subject, this page is about something else.
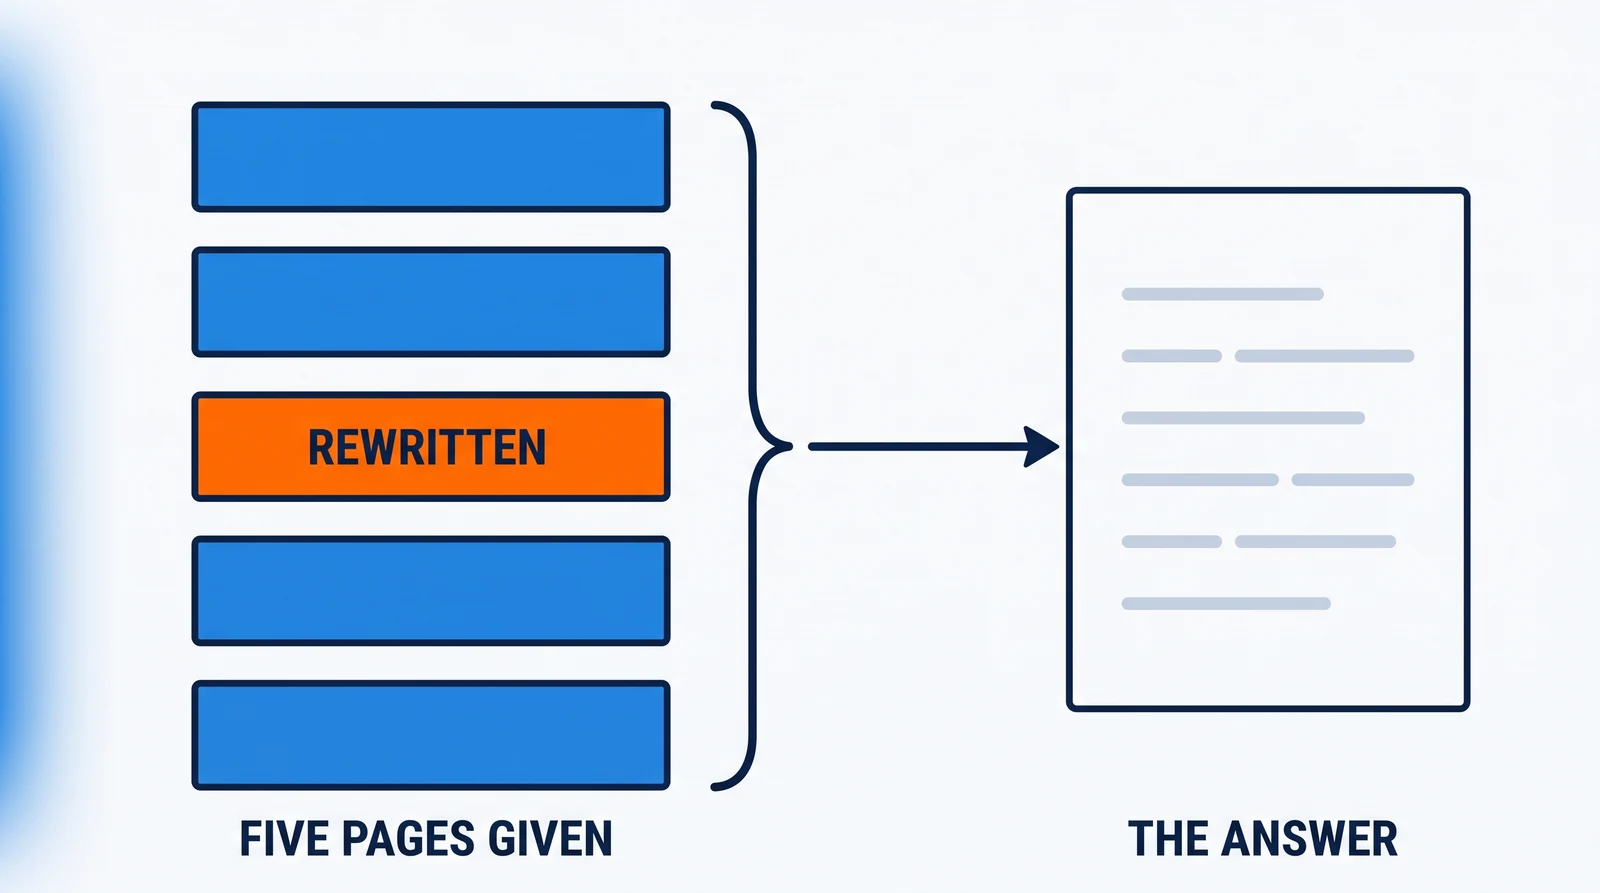
The test behind it was narrower than the question. Its authors ran their own generative engine: gpt-3.5-turbo, a large language model (LLM), writing an answer from the top five Google results for each query and crediting at least one of them on every sentence. For that model, the paper's reference is OpenAI's "Introducing ChatGPT" post. For each query they rewrote one of those five results with a language model, in one version to add numbers, and scored the rewrite by how much of the finished answer it earned. The work was first posted in November 2023 and appeared at the KDD conference in August 2024.
That result is real and carefully reported, and it measures something other than a citation rate. This desk has not tested the tactic. Every number that follows comes from the paper's tables or from the publisher quoted beside it, and each sentence names which.
Does adding statistics increase AI citations?
Adding statistics to a page raised its share of an AI-written answer by about 31% in the paper's experiment on gpt-3.5-turbo, which never measured whether a page gets cited by AI assistants at all.
A rewritten page scored 25.2 against 19.3 unmodified on Position-Adjusted Word Count, the Overall column of Table 1: a gain of 5.9 points on the paper's scale, or about 31% by our arithmetic. On the second measure, Subjective Impression, the Average column reads 23.7 against 19.3, about 23%. Both figures come from gpt-3.5-turbo answering 1,000 benchmark queries, each from five documents it was given.
Every page in that test was already one of the five. The model had no say in what it read, and in AI search as it works on ChatGPT or Google AI Overviews, that is the step deciding whether your page is read at all.
When all five pages were rewritten the same way, the gains went to the lower-ranked ones, and the top-ranked result lost share (Table 2).
And the added figures did not have to be real: the prompt the authors published asked for figures "even if hypothetical".
None of this shows that numbers fail to help. It does not show that they earn citations from the assistants you use in 2026 either. The experiment did not test that, and neither have we. Two later benchmarks that came closer to that question found the same rewrite of a page's text did not raise its standing on their measures, and mostly lowered it; the section on later tests below sets out how they were run.
What exactly did the paper test?
The paper tested whether rewriting one of the five search results handed to gpt-3.5-turbo changes how much of its answer that result earns, across nine rewriting methods and a benchmark of 10,000 queries.
The authors are Pranjal Aggarwal of the Indian Institute of Technology Delhi; Vishvak Murahari, Karthik Narasimhan and Ameet Deshpande of Princeton University; and Tanmay Rajpurohit and Ashwin Kalyan, who list themselves as independent researchers. Three of the articles ranking for this question call it the Princeton GEO study. We read v3 on arXiv, dated 28 June 2024, which is the text of the KDD '24 paper (DOI 10.1145/3637528.3671900). The study is careful about what it measured, and its authors publish their code and data, which is why every figure here can be checked.
The benchmark, GEO-bench, holds 10,000 queries gathered from nine collections, among them MS MARCO, Natural Questions, the ELI5 forum, Perplexity's Discover page and questions written by GPT-4. It is split 8,000, 1,000 and 1,000 for training, validation and testing. By the paper's description, 80% of the 10,000 queries are informational, and they cover 25 subject domains such as arts, health and games. The published results use the 1,000-query test split, averaged over five random seeds.
Each query came with the cleaned text of the top five Google results. The LLM wrote its answer from those five pages only, under a prompt telling it that every sentence should be "immediately followed by an in-line citation to the search result(s)" (the prompt's own emphasis marks are dropped here). Every sentence was meant to credit at least one of the five.
For each query, one page was picked at random and rewritten by GPT-3.5 turbo once per method, while the other four stayed as they were. The nine methods run from Keyword Stuffing to Statistics Addition, which the paper defines as a change that "Modifies content to include quantitative statistics instead of qualitative discussion, wherever possible". Each rewrite was scored against the same text, unmodified, on the same query.
That structure isolates the rewrite well. The query, the other four documents and the model are held still, so a change in the score belongs to the rewrite, apart from the run-to-run variation the five seeds are there to average out.
Did the added statistics have to be true?
The added statistics did not have to be true, because the prompt the authors published for rewriting allowed invented ones.
The paper sends readers to its public repository for the prompt behind each method. In that repository's code, the Statistics Addition prompt asks the model to "Add positive, compelling statistics (even if hypothetical) at multiple relevant places in the text." Its examples of what counts are generic: "x% growth in marketing, numbers in scientific texts, interesting numerical facts". The Quotation Addition prompt asks for more quotes "even though fake and artificial", and the Cite Sources prompt says "You may invent these sources". GitHub dates the file to 26 November 2023, ten days after the first version of the paper.
A 70% figure without a reference raised one result's visibility by 65.5% in the paper's own worked example (Table 4). For the query "Should robots replace humans in the workforce?", the rewrite inserted "with a staggering 70% increase in robotic involvement in the last decade", and nothing in the example says where that number came from.
We think this is a fair way to ask the authors' question, which is whether a model favours text that carries numbers. It does mean the result cannot say whether an accurate, sourced figure does better than an invented one, because the design never separated the two, and none of the seven qualities the paper's judge scored is accuracy. The authors hid none of it: the method prompts sit in their public repository because they put them there.
A number on your page is a claim with your name on it, whatever a model does with it.
Is the paper's "visibility" the same as being cited?
The paper's visibility is not a citation rate but the share of one answer that a page earns, among five documents the model already had in front of it.
The first measure, Position-Adjusted Word Count, counts the words in the answer's sentences that credit a page, splits a sentence's words equally when it credits several, and weights sentences near the top more heavily with an exponentially decaying factor. The second, Subjective Impression, has GPT-3.5 score seven qualities of each credited source: relevance, influence, uniqueness, subjective position, subjective count, the likelihood of a click and diversity. That score is then rescaled onto the first measure's scale. Both are normalised, in the paper's words, "so that the sum of the impressions of all citations in a response equals 1".
On the first measure, then, a score is a page's share of the answer's words; on the second, it is a share of the judge's scores for that answer, after the same normalisation. A gain compares two answers: the one the model wrote from the original five documents, and a fresh one it wrote after the rewrite.
The authors use "citation" for a website credited inside an answer: "the visibility of a website (also referred to as a citation)". We think that wording is part of how "visibility" became "citations" as the result was retold.
xseek's article by Marc-Olivier Bouchard, dated 9 July 2026, says the methods "increase how often AI engines cite a source by up to 40%". The 40% in the paper is a larger slice of answers the document was already part of, not a count of how often it was cited. Conbersa's article by Neil Ruaro, dated 3 August 2026, calls the tactic "one of the highest-impact content tactics" and reports the result as "AI visibility", which is closer to the paper's own word.
How large was the gain?
In Table 1, Statistics Addition gained about 31% on the word-count measure and about 23% on the judged measure, second of the nine methods on both.
Table 1's cells, on the Overall column of Position-Adjusted Word Count and the Average column of Subjective Impression, with the percentages our arithmetic from them:
- No Optimization: 19.3 and 19.3
- Statistics Addition: 25.2 and 23.7, about 31% and 23% above it
- Quotation Addition: 27.2 and 24.7, about 41% and 28% above it
On the table's first column, the word count before position weighting, Statistics Addition's pair is 25.9 against 19.5.
Quotation Addition came first on both, and it owns the line in Table 1's caption: "The best methods improve upon baseline by 41% and 28% on Position-Adjusted Word Count and Subjective Impression respectively." The results section groups Cite Sources, Quotation Addition and Statistics Addition at "a relative improvement of 30-40% on the Position-Adjusted Word Count metric and 15-30% on the Subjective Impression metric". The abstract's headline, "GEO can boost visibility by up to 40% in generative engine responses", is the top of that range across methods, not a result for numbers alone.
Keyword Stuffing, the method the caption calls "traditionally used in SEO", scored 17.7 on the Overall column, below the unmodified 19.3. Google's spam policies describe keyword stuffing as filling a page with keywords or numbers "in an attempt to manipulate rankings in Google Search results". For anyone arriving from SEO, that is the table's plainest lesson: the old ranking-manipulation tactic made a page take up less of the answer, not more.
Paired with fluency editing, Statistics Addition reached 35.8% on the word-count measure in Figure 4, which combines the four best strategies two at a time on a 200-example subset of the test queries. Paired with quotes it reached 35.4%, with citations 30.3%, and alone 27.0%, so no pairing in Figure 4 reaches 40%. Conbersa's article credits the tactic with "up to a 40% lift in AI visibility when combined with citations and quotations", and its FAQ says "adding statistics lifts AI visibility by up to 40%". Figure 4's own numbers for those two pairings are 30.3% and 35.4%, and it tests no three-way mix.
Across the five random seeds, Statistics Addition averaged 25.5, give or take 1.2, against an unmodified 19.8, give or take 0.6, on the Overall column of the appendix's Table 6. In that setup the gain sits well clear of the variation between runs.
Which pages gained when all five were rewritten?
Lower-ranked pages gained and the top-ranked page lost when all five were rewritten to add numbers at once: in Table 2's Statistics Addition row, the fifth-ranked page gained 97.9% in visibility and the first-ranked page lost 20.6%.
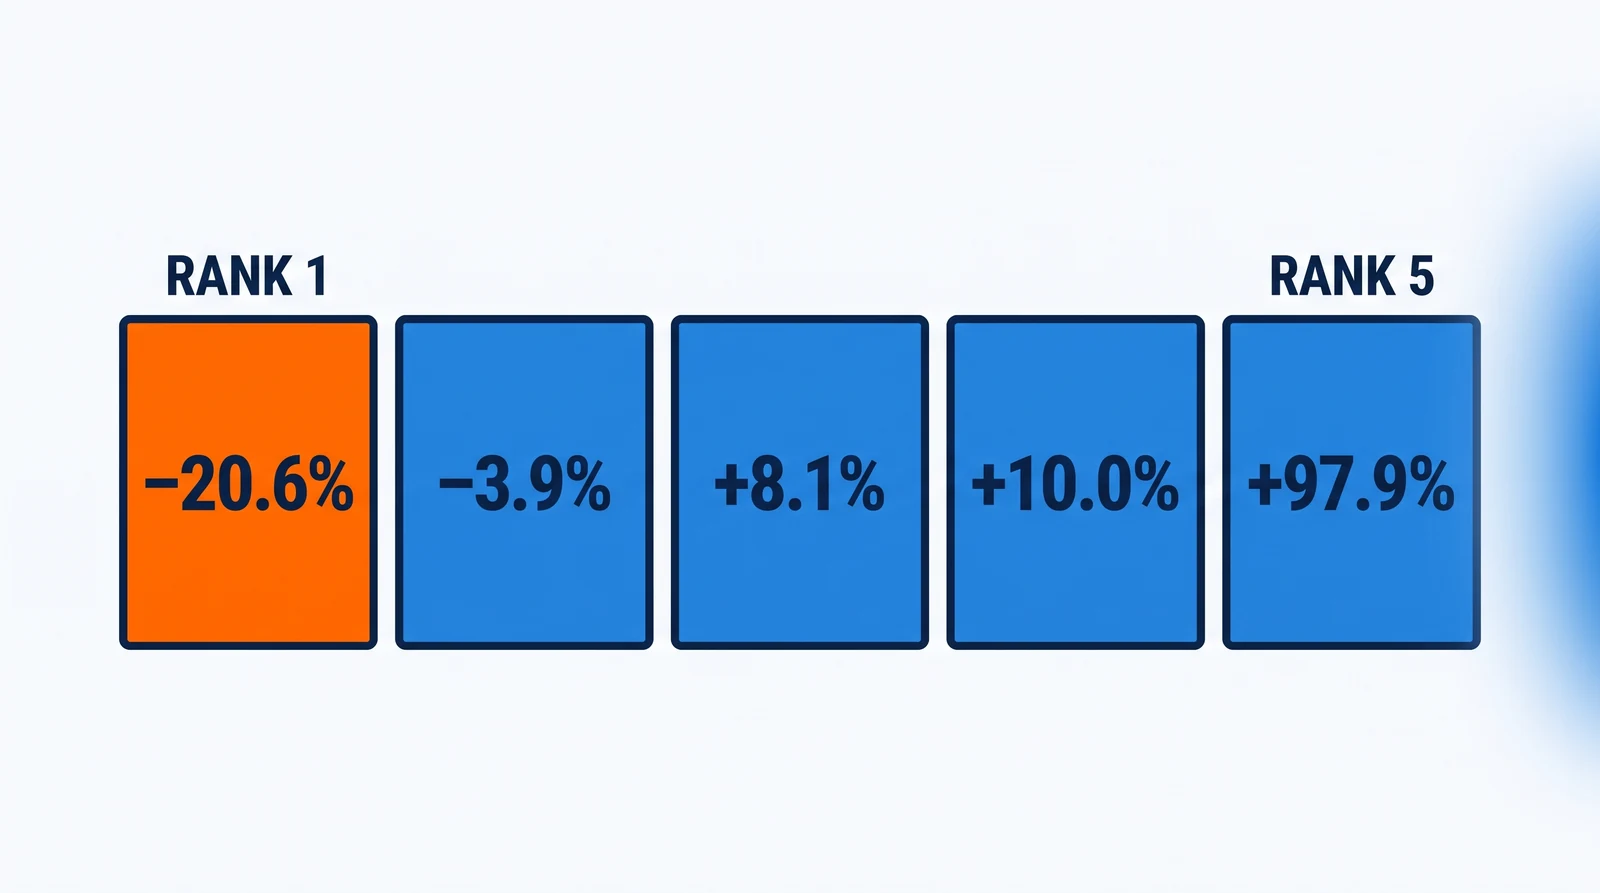
Table 2 comes from a different condition from Table 1. The paper introduces it in its analysis section, 5.2: "we conducted an evaluation of GEO methods by optimizing all source contents simultaneously, with results presented in Table 2." Its question is what happens once every page in an answer has been rewritten the same way.
By search rank, the Statistics Addition row reads:
- rank 1: −20.6%
- rank 2: −3.9%
- rank 3: +8.1%
- rank 4: +10.0%
- rank 5: +97.9%
Quotation Addition runs from −22.9% at rank 1 to +99.7% at rank 5, and Cite Sources from −30.3% to +115.1%. That last cell, the Cite Sources row at rank 5, also turns up in advice about backlinks.
The authors read the table as good news for small publishers: "lower-ranked websites, which typically struggle for visibility, benefit significantly more from GEO", which they call "GEO's potential as a tool to democratize the digital space". Their reason is that "traditional search engines rely on multiple factors, such as the number of backlinks and domain presence, which are challenging for small creators to achieve". The Digital Bloom's report carries the same reading: "Lower-ranked traditional SERP sites benefit significantly more from GEO optimization than top-ranked sites".
Our reading adds one thing the table implies. Each answer's scores are normalised to add up to one, so in this condition a gain for one page is a loss for another, and Table 2 shows five rewritten documents dividing a freshly written answer among themselves. The first-ranked page's 20.6% loss is part of what paid for the gains lower down. The caption does not say which of the two measures the cells use, and the paper gives no rank breakdown for the single-document test.
What changed when the test moved to Perplexity?
Statistics Addition gained about 37% on Subjective Impression on Perplexity but only about 9% on Position-Adjusted Word Count: 33.9 against 24.7, a gain of 9.2 points, and 26.2 against 24.1 (Table 7).
Two hundred test queries went to Perplexity with their sources supplied as files. The appendix explains that Perplexity "does not allow the user to specify source URLs", so the authors "provide source text as file uploads to perplexity.ai while ensuring all answers are generated only using the file sources provided". Across those 200 queries, Perplexity's model divided each answer among the uploaded files, and its own web search chose none of them.
The Table 7 caption gives the headline: the best methods improve "by 22% on Position-Adjusted Word Count and 37% on Subjective Impression". In the text, the 22% belongs to Quotation Addition and the 37% to Statistics Addition. Cite Sources moved the other way on the judged measure, 19.0 against an unmodified 24.7, so the methods did not move together from one engine to the next.
Both numbers appear in articles ranking for this question. xseek's "37% uplift" is the file-upload test's figure on the judged measure; the article presents it as a way to "Boost Citation Rate 37%", from "the same Princeton experiment" as the 40%. The Digital Bloom's report by Vlad Kuriatnyk, published on 14 December 2025 and updated since, prints "Adding statistics increases AI visibility by 22%; quotations by 37%", and its FAQ advises readers to "include data-backed statistics". In the paper the pairing runs the other way: 22% for Quotation Addition on one measure, 37% for Statistics Addition on the other. We found no place in it that gives statistics 22% and quotations 37%.
Have later studies tested the same rewrite?
Two later benchmarks re-ran the paper's Statistics rewrite of a page's text on newer models, and on their measures it did not raise the page's standing and mostly lowered it.
C-SEO Bench, by Haritz Puerto and four co-authors, was first posted in June 2025 and accepted at the NeurIPS 2025 Datasets and Benchmarks track. It used the GEO paper's own rewriting prompts on more than 1,900 queries in six domains, from product recommendations to news and debate questions, and handed each query's documents to gpt-4o-mini, Claude 3.5 Haiku, o3 and o4-mini, as the GEO paper handed them to its model. It scored a page by how early the answer cited it, not by its share of the words. Across those four models and six domains, in the authors' words, "the Statistics method decreases rankings in 19 out of 24 evaluated settings".
SAGEO Arena, by Sunghwan Kim and four co-authors, was first posted in February 2026 and accepted at KDD 2026; the version we read is dated 7 August 2026. It adds the search step the GEO paper left out: its pipeline searches 171,003 web documents gathered from Google results for 2,700 queries in nine domains, a reranker passes ten of them on, and GPT-5-mini writes the answer. In its Table 2, rewriting a page's body text to add statistics moved the share of those 2,700 queries in which the page was cited from 0.50 to 0.48, and nine in ten of the rewritten pages still reached the reranker's ten, against every one before. The same rewrite applied to a page's title, meta description, headings and schema markup raised that share to 0.54.
Neither benchmark is a live assistant. C-SEO Bench supplied its models their documents, and SAGEO Arena searched a fixed collection of its own, so neither tested ChatGPT, Perplexity's web search or Google AI Overviews as they run.
What would you need to know about your own site?
Whether an AI assistant fetches your page at all is the question the paper was not built to answer. In AI search as it runs on ChatGPT, Perplexity's web search or Google AI Overviews, an AI system decides what to read before it writes, and the experiment made that decision for its model. Apart from Perplexity with uploaded files, the paper tested no live assistant directly: not ChatGPT, Claude, Copilot or Google AI Overviews.
Nor can it say whether a true, sourced figure behaves like a hypothetical one, or whether the pattern holds on the models of 2026 rather than gpt-3.5-turbo. The authors say themselves that their methods "may need to adapt over time as GEs evolve", and that "owing to the black-box nature of search engine algorithms, we didn't evaluate how GEO methods affect search rankings". The impact on your SEO, in other words, is outside its scope.
This desk has not tested statistics, and our published advice on carrying a claim rather than handing it on is about attribution, not numbers.
Whether a number belongs in your content is a question about what your reader needs and what you can source, with your own data where you have it. No benchmark can settle that for you, and this one never claimed to.
What people ask about the GEO study
People ask why the tactic would work, how many figures to add and who ran the research.
Why do statistics increase AI citations?
The GEO paper does not show that statistics increase AI citations; it shows that on its engine a page rewritten with numbers took a larger share of an answer it was already part of. It did not test why. The authors' explanation is that such methods "significantly improve visibility in GE responses, enhancing both the credibility and richness of the content", a reading of their results rather than a measured mechanism.
How many statistics should a piece of content include?
The paper tested no specific number of figures per page. Its prompt asked for figures "at multiple relevant places in the text", and the count was never varied, so no count can be read from the results. Any specific range you meet did not come from this experiment.
Is the GEO study a Princeton study?
The paper is partly a Princeton study: three of its six authors list Princeton University, the first author lists the Indian Institute of Technology Delhi, and two list themselves as independent researchers in Seattle. No other affiliation is printed.
What you can check in the paper yourself
Every figure here that comes from the paper, down to each data point in its tables, sits in a twelve-page paper anyone can open on arXiv. Table 1's Overall and Average columns, read against the No Optimization row, give each method's gain on the benchmark. The first paragraph of section 5.2 says the rank table rewrote every page at once. A short paragraph in Appendix C.1 says how the Perplexity test was run and on how many queries. The repository linked from Appendix B.5 holds the prompt each rewrite used.
Read those passages before you rewrite a site for AI search. You will know which pages the famous numbers were measured on, and what it would take for them to describe yours.
Sources
- GEO: Generative Engine Optimization — Pranjal Aggarwal, Vishvak Murahari, Tanmay Rajpurohit, Ashwin Kalyan, Karthik Narasimhan and Ameet Deshpande; KDD '24, DOI 10.1145/3637528.3671900. Version 3, 28 June 2024 (first version 16 November 2023); Tables 1, 2, 4, 6 and 7, Figure 4, sections 5.2 and 9 and Appendix C.1 read; checked 24 September 2026.
- GEO-optim/GEO — src/geo_functions.py — the authors' public repository, holding the prompt for each method. File dated 26 November 2023; checked 24 September 2026.
- The Digital Bloom — 2025 AI Citation & LLM Visibility Report — Vlad Kuriatnyk. Published 14 December 2025, updated 10 May 2026; checked 24 September 2026.
- xseek — 9 GEO Strategies That Increase AI Citations by 40% — Marc-Olivier Bouchard. Published 9 July 2026; checked 24 September 2026.
- Conbersa — Why Do Statistics Boost AI Search Citations? — Neil Ruaro. Published 3 August 2026; checked 24 September 2026.
- C-SEO Bench: Does Conversational SEO Work? — Haritz Puerto, Martin Gubri, Tommaso Green, Seong Joon Oh and Sangdoo Yun; NeurIPS 2025 Datasets and Benchmarks Track. Version 3, 20 October 2025 (first version 6 June 2025); section 6.2, Tables 3 and 4 and Appendix E read; checked 24 September 2026.
- SAGEO Arena: A Realistic Environment for Evaluating Search-Augmented Generative Engine Optimization — Sunghwan Kim, Wooseok Jeong, Serin Kim, Sangam Lee and Dongha Lee; KDD 2026. Version 2, 7 August 2026 (first version 12 February 2026); sections 3 to 5 and Table 2 read; checked 24 September 2026.
- Google Search Central — Spam policies for Google web search — the keyword stuffing definition. Last updated 28 August 2026; checked 24 September 2026.